
Optimizing structural maintenance to track and record variables for business continuity and historical analysis
Data Visualization for a E-Commerce giant
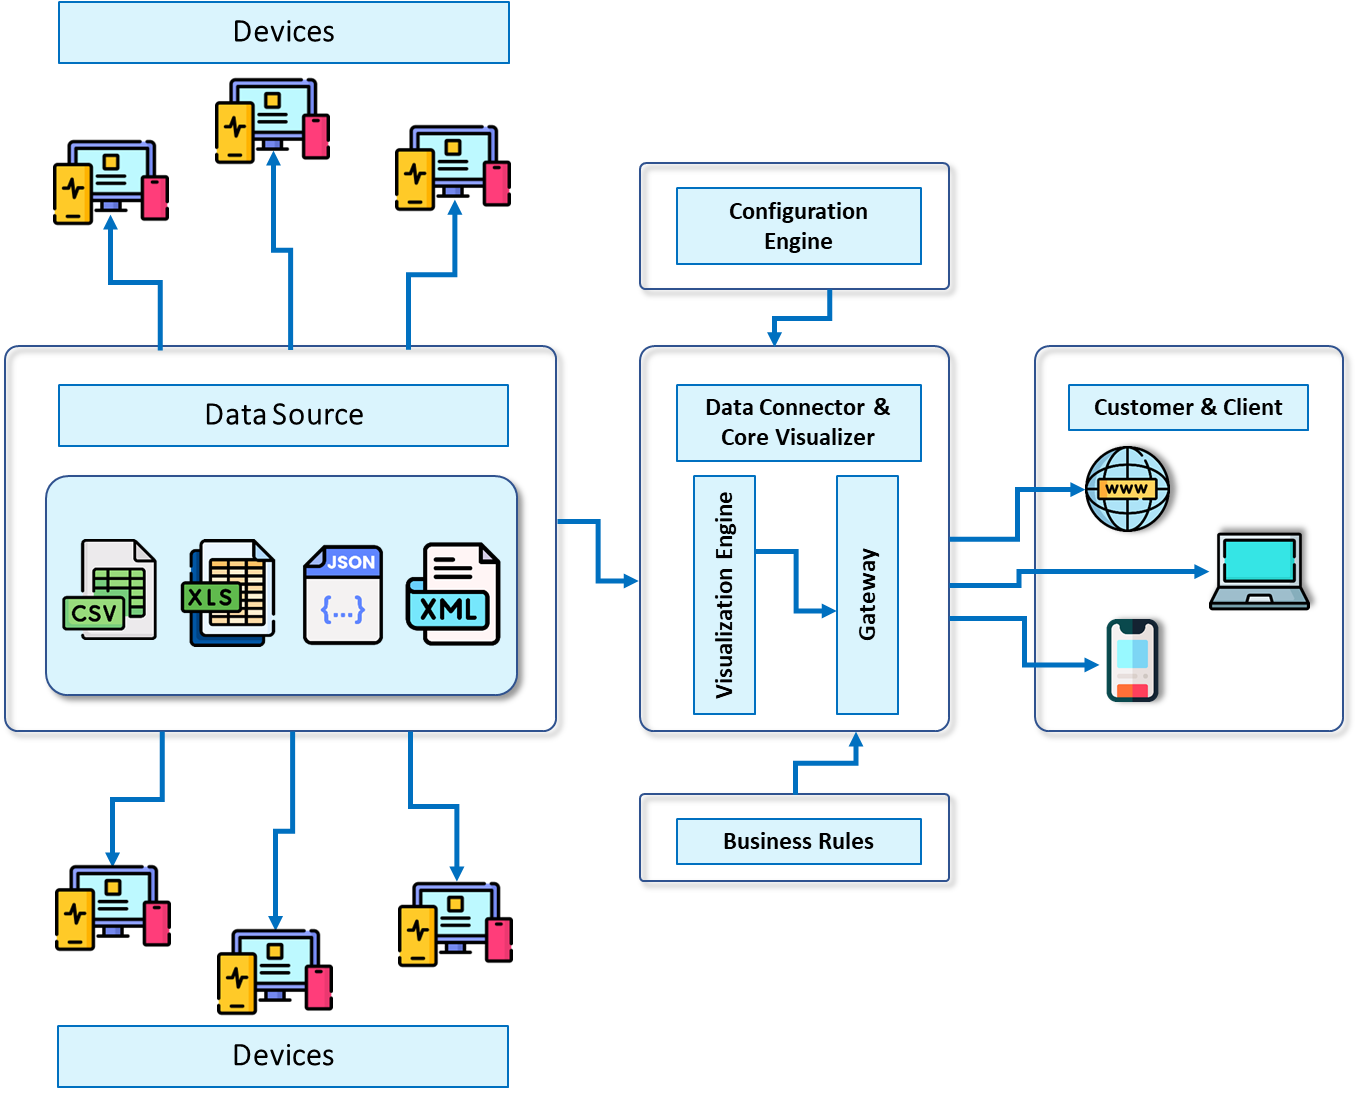
Our client is a multinational technology company that specializes in e-commerce, cloud computing, digital streaming, and artificial intelligence. The company is known for disrupting industries through technological innovation and reinvesting profits into capital expenditures. We used modern principles and methodologies of data warehouse design to provide analytical capabilities and integrated data from various sources, presenting valuable insights. Our primary objective was to collect sensor data, visualize it against a selected timeline, and provide meaningful insights.
×
![]()
The software empowers the company to track individual and group sensor readings, set conditional alarms, and retrieve statistical data. The following factors drive business value:
- Utilization of sensor-based data to generate interactive graphical representations.
- Generation of reports enabling the company to identify and address any structural discrepancies easily.
- Measure Sensor Drift against benchmark values
- Measure and control drift in sensor networks
- High-precision synchronized sensing
- Algorithms used in damage detection and localization
- Solutions to network design challenges - scalability, time synchronization, sensor placement, data processing
- Strategies to alleviate or eliminate drift, auto-calibrating sensors, minimize data loss and timestamp errors
- Integrating remote sensing grid such as unmanned aerial vehicles, video-based, infrared cameras for streaming or integrated video feed, GPS, advanced cloud computing
